
Anyone Can Code.
Anyone Can Code.

A flowchart is a diagrammatic/graphic representation of an algorithm/pseudocode i.e. a step-by-step approach to solving a task.
There are 4 shapes in a flowchart:


Example 1:
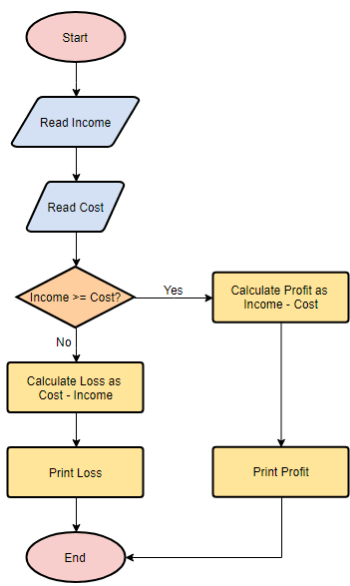
In the example above, the first thing we would do is input 2 variables- income and cost. This just means that we need to plug in 2 values for them (if not provided) and then continue to the next box. “Income >= Cost?” means we have to compare the income and the cost and make a decision. If income is >= cost then we need to go to the box on the right and do income-cost to find and print profit. If income is not >= cost then we continue to the box below then. In that case, we will do cost- income to find and print loss.
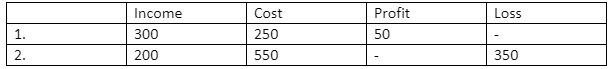
The table would look like this for 2 different scenarios:
Example 2:
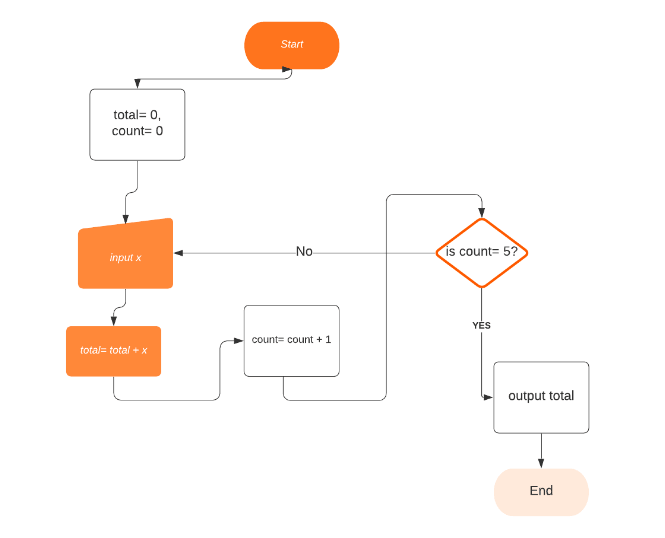
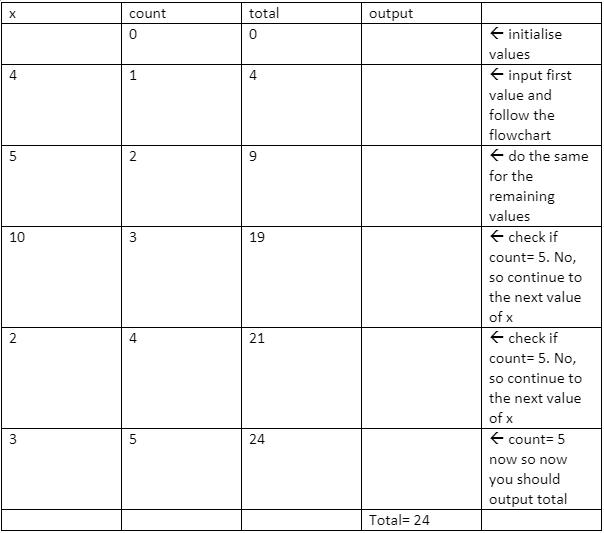
Explanation:
‘Count’ and ‘total’ are variables in the flowchart above. This means their values can be changed throughout
the flowchart. Their initial values are 0 each but when the first x is input, the total becomes total + x.
This means 0+4= 4 and count is also increased by one. 0+ 1=1. After this we check if count=5. Since 1 does
not equal to 5, you follow the no arrow and input the second x provided (which is 5). After making x as 5,
you follow the arrow and make total= total + x. Since the value of total is now 4, the total is 9 (4+5) and
the count becomes 2. You repeat this process until count= 5. Once count=5, you write the current value of
total (when count=5), which in this case is 24 and hence 24 is printed in the output column.
That's the end of the tutorial! if you enjoyed it please check out our other tutorials and articles, all for FREE. Also check out our YouTube Channel and Instagram. We put daily content including Word of the Day, Fun Facts, Quote of the Week, Quizzes and much more!
This site uses cookies to improve your experience as well as for site metrics. To see more, check out our Privacy Policy
This site uses cookies to improve your experience as well as for site metrics. To see more, check out our Privacy Policy